Waveform Graph Exercise
Exercise
Section titled “Exercise”Exercise: Visualizing Multi-Signal Data with a Waveform Graph
Please follow the below exercise to understand how the Waveform Graph can visualize multiple data streams and mathematical signal processing in real-time.
Configuration
Section titled “Configuration”The following configuration is used to set up this exercise.
Tag Configuration
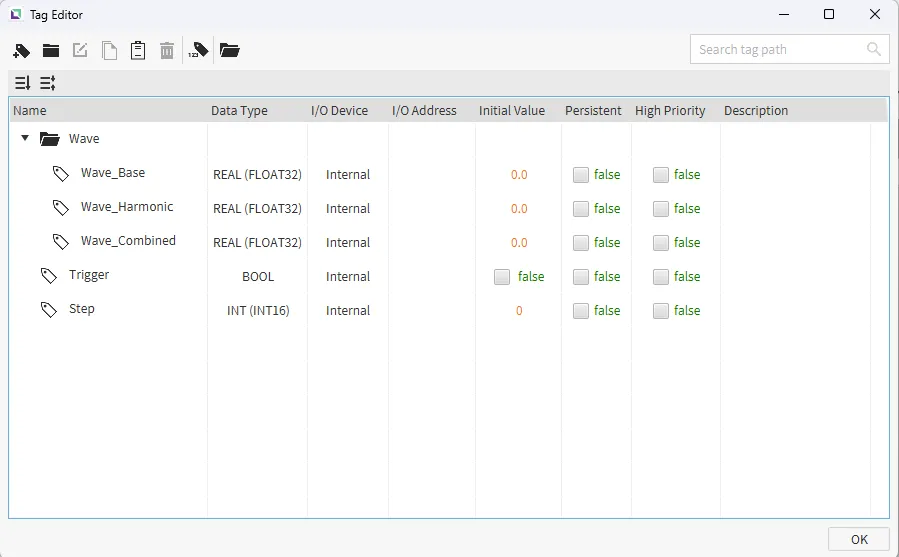
Section titled “Tag Configuration”- Create a tag group named Wave, and add the following tags:
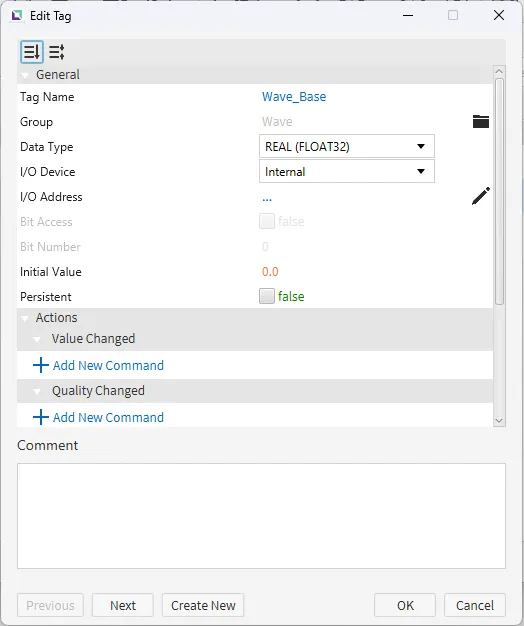
- Wave_Base
- Data type: REAL (FLOAT32)
- Initial value: 0
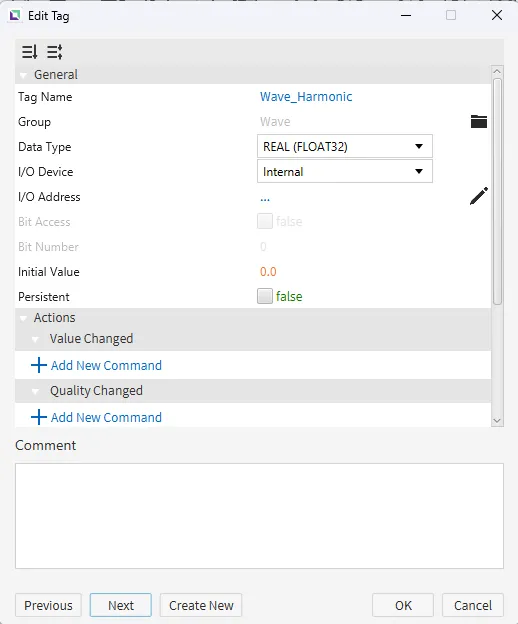
- Wave_Harmonic
- Data type: REAL (FLOAT32)
- Initial value: 0
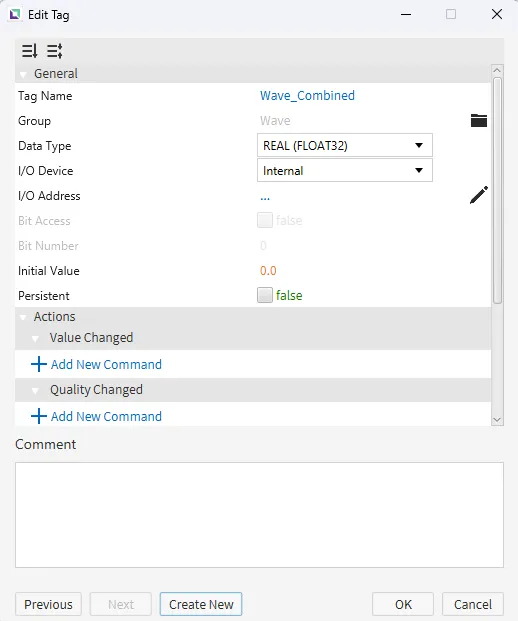
- Wave_Combined
- Data type: REAL (FLOAT32)
- Initial value: 0
- Wave_Base
- Create two additional tags separately (not within the group):
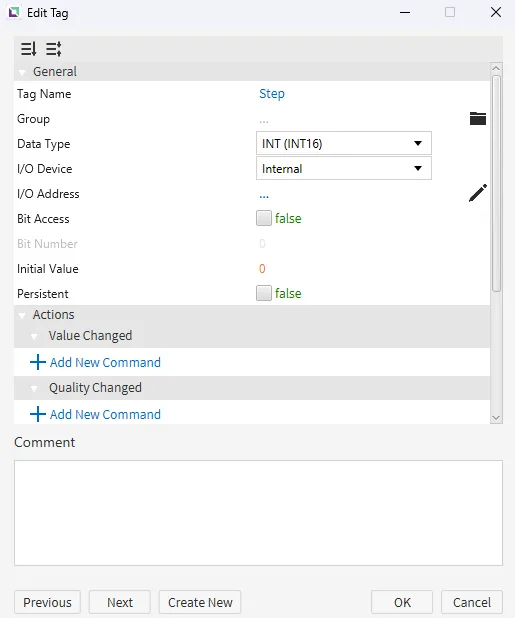
- Step
- Data type: INT (INT16)
- Initial value: 0
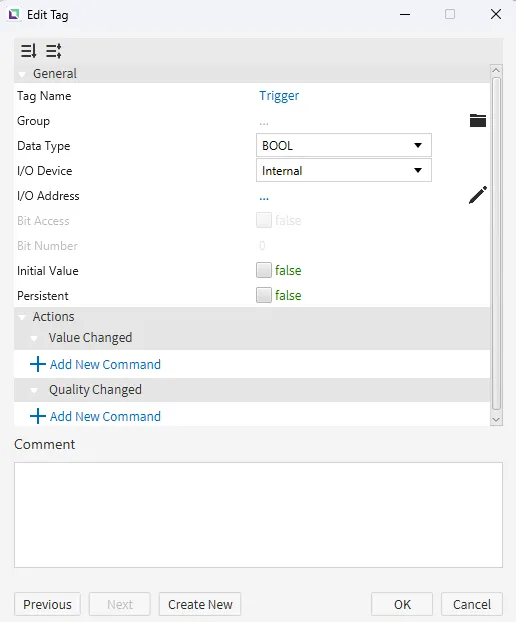
- Trigger
- Data type: BOOL
- Initial value: 0
- Step
Script Configuration
Section titled “Script Configuration”- Create the following script to calculate the mathematical relationship between the signals:
- GenerateComplexWave
- Running type: Manual
- GenerateComplexWave
// 1. Get the current positionvar x = tag.read("Step");
// 2. Calculate the Base Wave (Slow and steady)var base = 40 * Math.sin(0.1 * x) + 50;tag.write("Wave/Wave_Base", base);
// 3. Calculate a Harmonic (Fast ripple)var harmonic = 10 * Math.sin(0.5 * x);tag.write("Wave/Wave_Harmonic", harmonic + 50); // Offset by 50 to center it
// 4. Calculate the Combined Signal (Base + Harmonic + "Noise")// Math.random() adds a little jitter to make it look like a real sensorvar noise = Math.random() * 5;var combined = base + harmonic + noise;tag.write("Wave/Wave_Combined", combined);
// 5. Advance the step and loop at 100if (x >= 100) {tag.write("Step", 0);} else {tag.write("Step", x + 1);}
Project Configuration
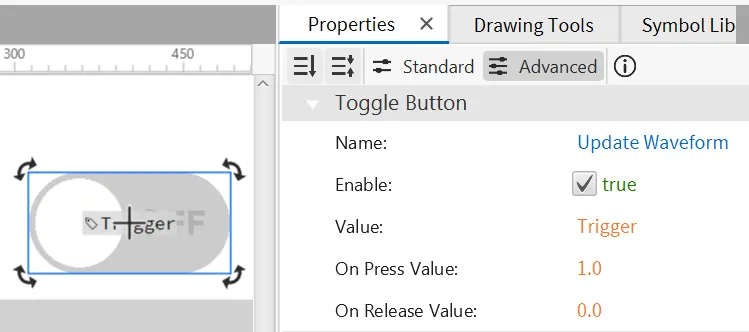
Section titled “Project Configuration”- Create a Toggle Button on the page.
- Set the Name to "Update Waveform".
- Drag and drop the Trigger tag onto the toggle button.
- Under the Actions properties, select Add New Command under On Press.
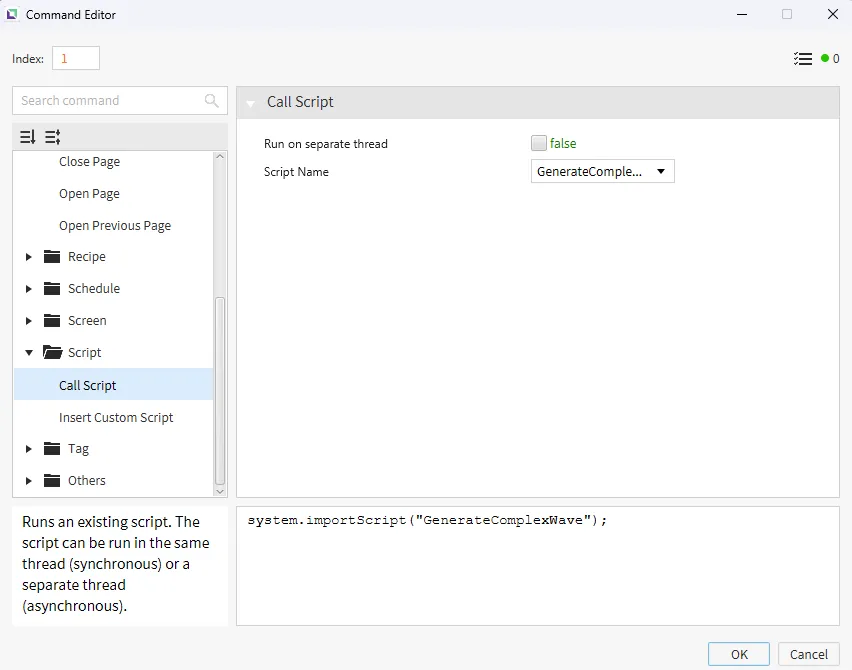
- Select the Script > Call Script command and call the GenerateComplexWave script.
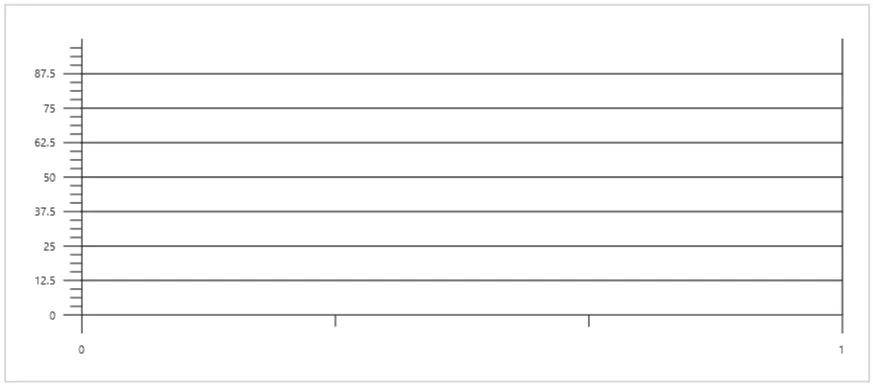
- Create a Waveform Graph by going to Insert > Waveform Graph or clicking the icon on the toolbar.
Waveform Graph Configuration
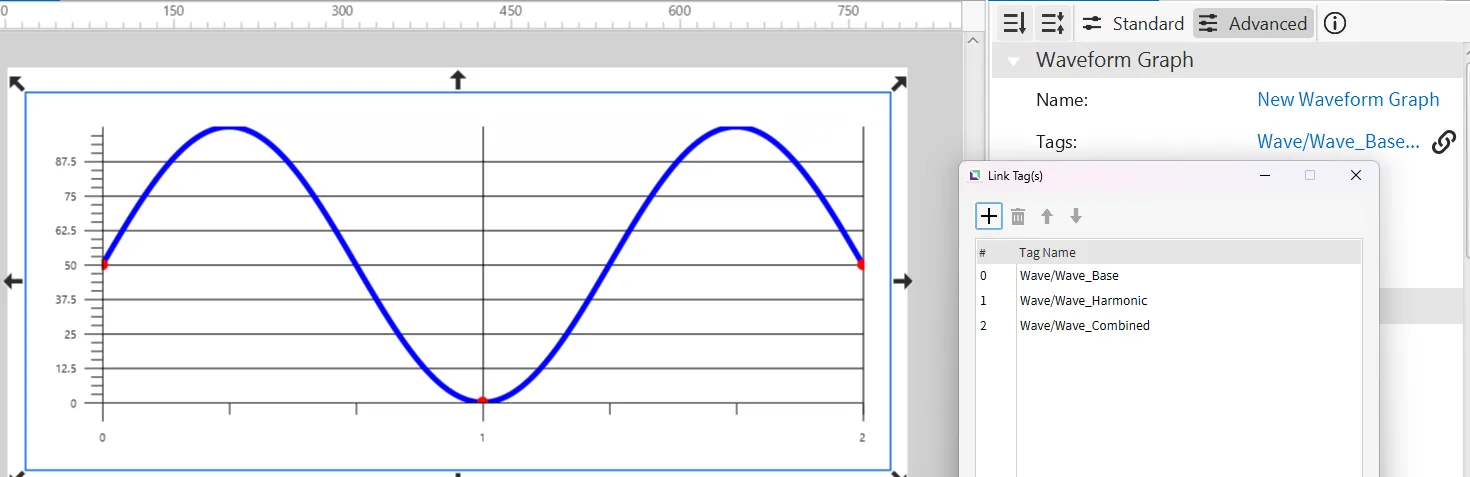
Section titled “Waveform Graph Configuration”- Bind Pens: Drag the Wave tag group onto the graph to include all three signals. Set visual properties:
- Dot Size: 10
- Dot Color: Red
- Stroke Width: 5
- Stroke Color: Blue
Project Deployment
Section titled “Project Deployment”-
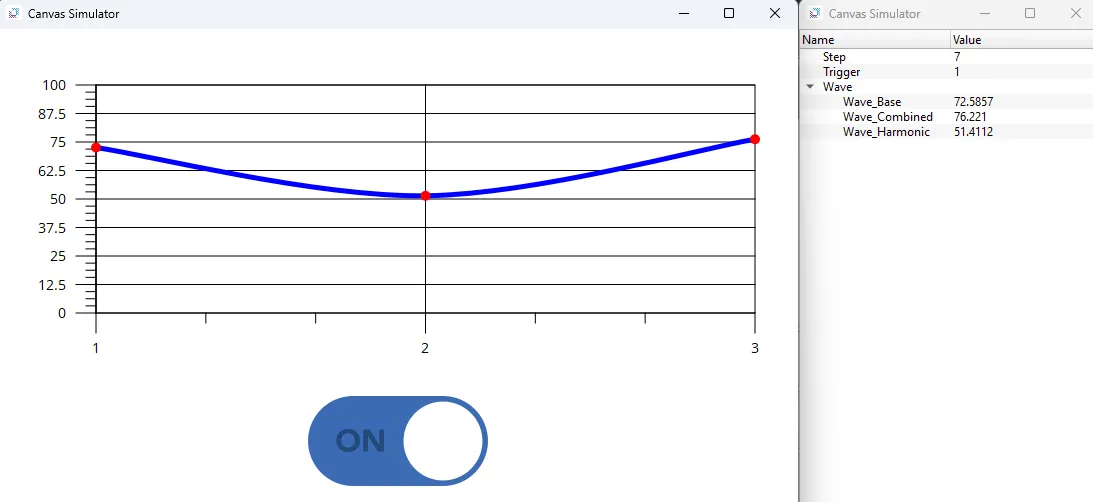
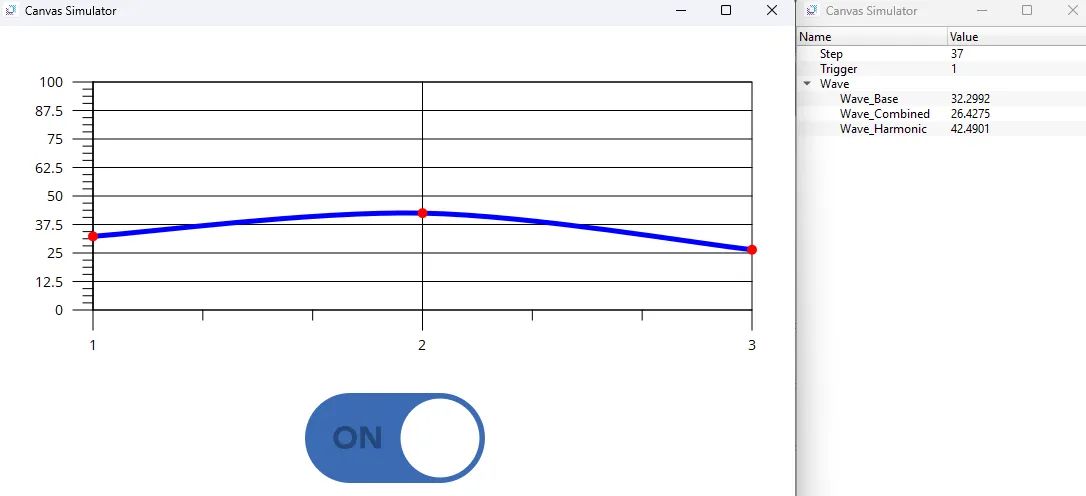
Click Tools > Launch Simulator to launch the Canvas Simulator.
-
Click the Update Waveform button repeatedly.
-
Observe how the Waveform Graph updates dynamically based on the changing tag values.