Sparkline Introduction
Sparkline Feature Description
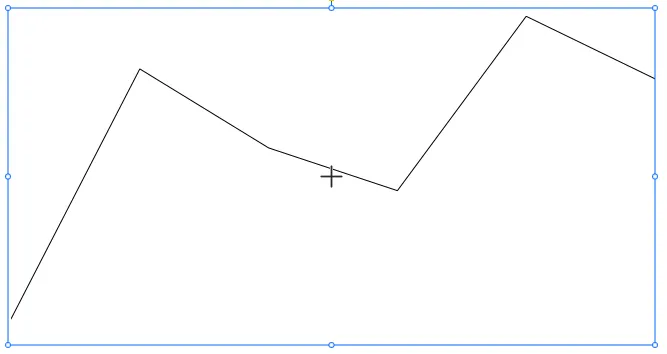
Canvas supports sparklines for visualizing data trends over time in a simple, lightweight manner. Sparklines are a versatile tool for embedding compact graphs and tracking real-time values.
![]()
Sparkline Properties
Sparklines are designed to show trends within a predefined range. Custom settings such as Min Value, Max Value, and Sample Period determine how data is displayed in real time. Additionally, options for customizing the stroke and appearance are provided.
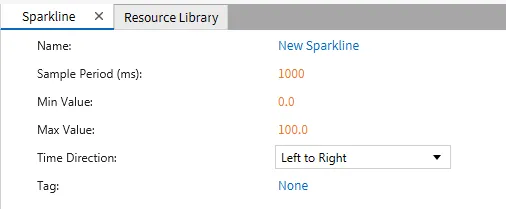
Sparkline Basic Properties
The basic properties of a sparkline include its Min Value, Max Value, and Sample Period. These settings determine the range and refresh rate of the sparkline. The Time Direction option allows you to define how the graph flows (e.g., from Left to Right).
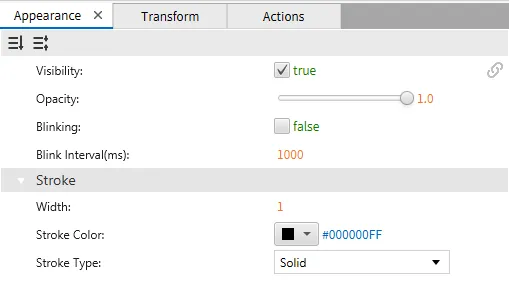
Sparkline Appearances
Sparkline appearance settings allow for full customization of how the sparkline looks. You can adjust properties such as Visibility, Opacity, and Blinking, as well as the Stroke settings to define the width and color of the line.
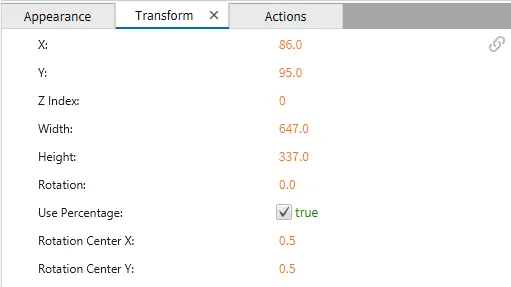
Sparkline Transformations
Transformations allow you to adjust the position, size, and rotation of the sparkline. Properties such as X, Y, Width, and Height control where and how the sparkline is displayed on the canvas.
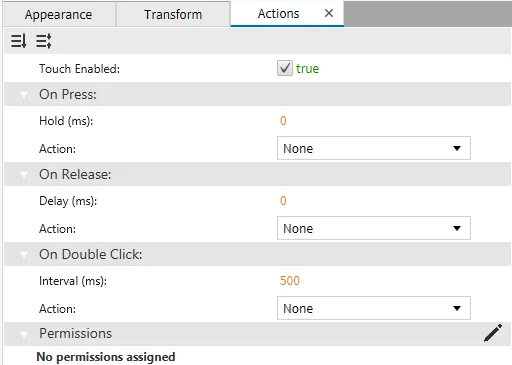
Sparkline Actions
The Actions tab lets you define what happens when interacting with the sparkline. You can specify actions for events like On Press, On Release, or On Double Click. These actions could trigger a script or another defined behavior within the application.