Waveform Graph Introduction
Waveform Graph Feature Description
Section titled “Waveform Graph Feature Description”Canvas provides a Waveform Graph for visualizing changing tag values in a continuous chart format. The graph updates automatically whenever the assigned tag value changes, allowing users to monitor live process data or variable fluctuations in real time.
Waveform Graph Designer Functionalities
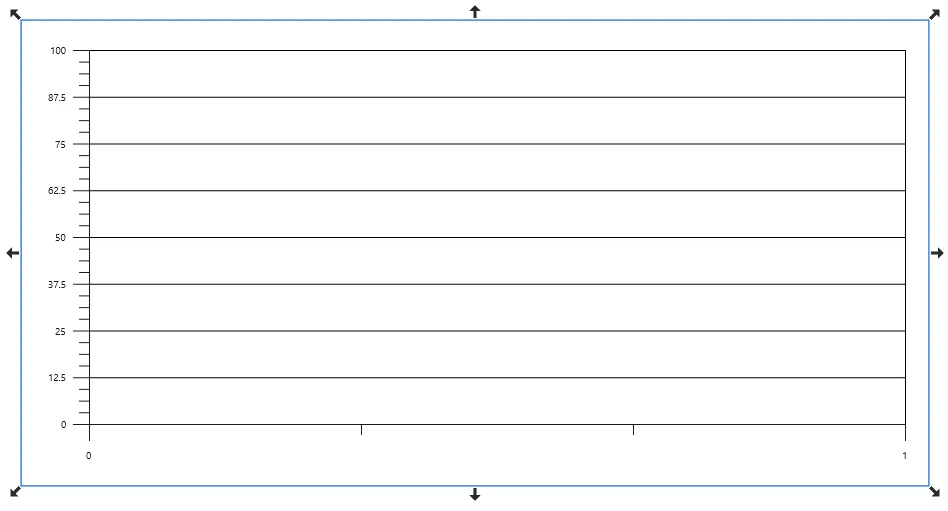
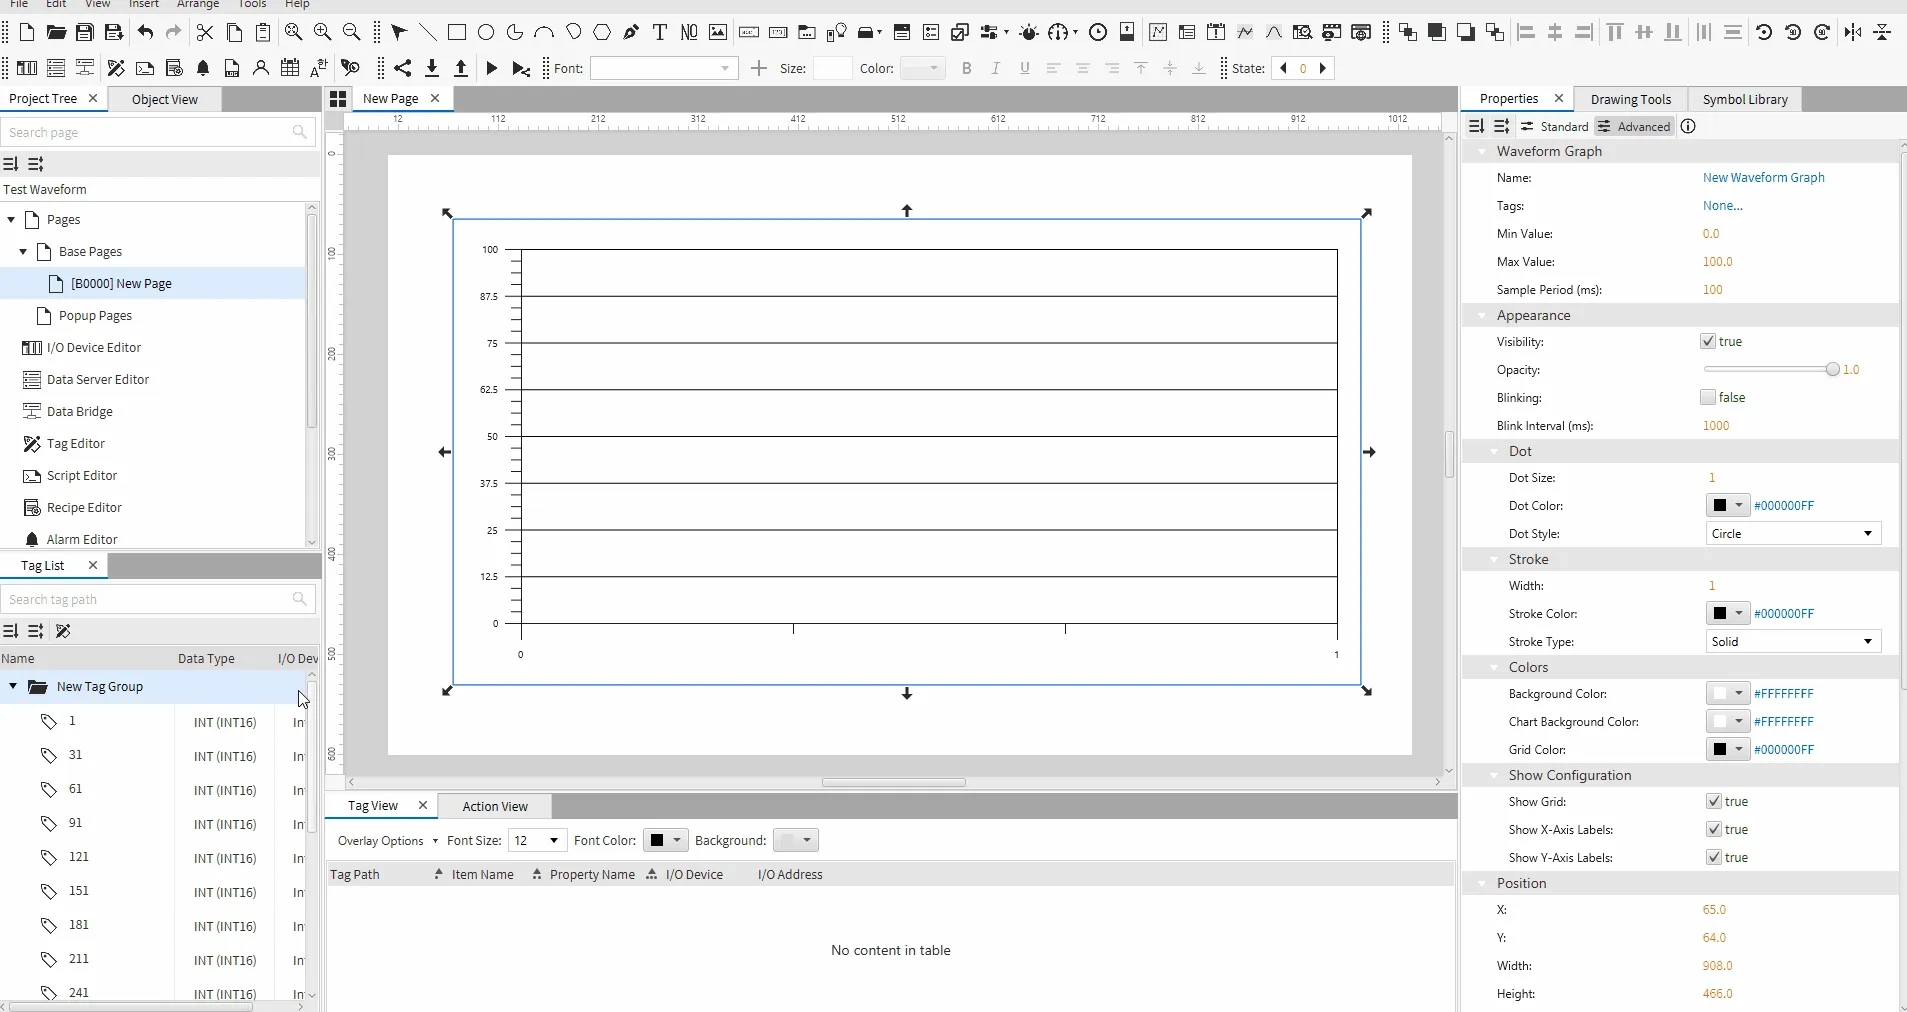
Section titled “Waveform Graph Designer Functionalities”To insert a Waveform Graph, go to Insert > Waveform Graph, or click the Insert Waveform Graph icon from the toolbar. Click and drag anywhere on the screen to place the graph, as shown below:
Properties
Section titled “Properties”The Waveform Graph includes multiple property groups that allow full customization of its appearance, behavior, and data settings.
To access the Property Window, click View > Properties.
Basic Properties
Section titled “Basic Properties”The Basic Properties section includes settings for the graph name, tag assignment, minimum and maximum values, and the sample period configuration.
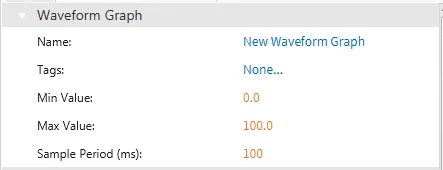
The Waveform Graph supports multiple tags, allowing several data points to be trended on a single chart.
Binding
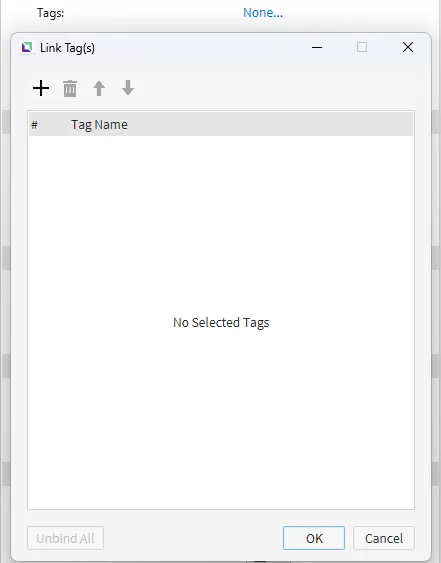
Section titled “Binding”There are two methods for binding a tag group to a graph: manual binding and smart binding.
- Manual Binding: A tag or tag group can be manually assigned by clicking the chain link icon next to the Tag property or by dragging a tag group directly onto the Tag property field.

- Smart Binding: A tag group can also be bound to the graph using drag-and-drop. Simply drag the desired tag group from the Tag List and drop it onto the Waveform Graph.
Appearance
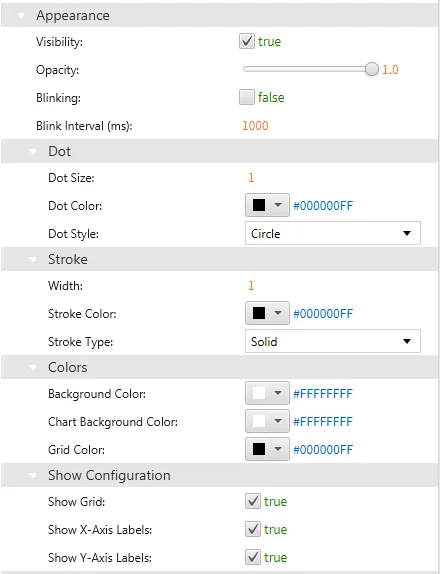
Section titled “Appearance”The Appearance section allows users to adjust the graph’s visual settings, including visibility, opacity, dot style, stroke width, stroke type, and display options such as grid lines and axis labels.
Position
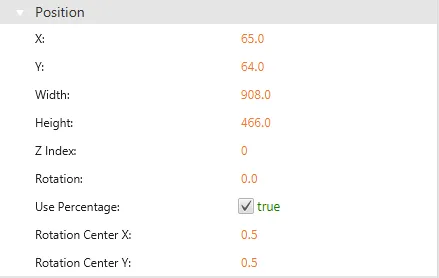
Section titled “Position”The Position section provides properties for adjusting the graph’s size, rotation, and placement on the screen.
Actions
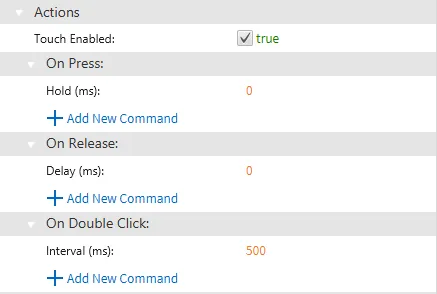
Section titled “Actions”If the Waveform Graph is pressed, released, or double-clicked, it can execute a script or command. These interactions are configured in the Actions tab under the On Press, On Release, and On Double Click sections.
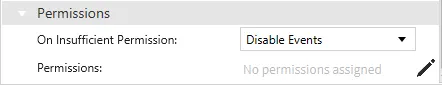
Permissions
Section titled “Permissions”Permissions can be assigned to the waveform graph to allow the correct users to interact with them.