Sparkline Introduction
Sparkline Feature Description
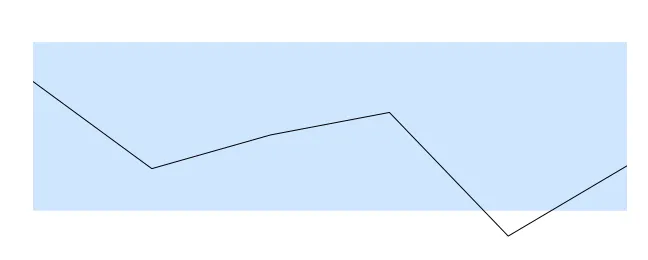
Canvas supports sparklines for visualizing data trends over time in a simple, lightweight manner. Sparklines are a versatile tool for embedding compact graphs and tracking real-time values.
Sparkline Designer Functionalities
Click Insert > Sparkline, or the Insert Sparkline icon on the toolbar, and click and drag on the page to bring up the sparkline as shown below:
Properties
The Sparkline object can be customized based on specific properties.
To ensure the property windows are enabled, click View > Properties.
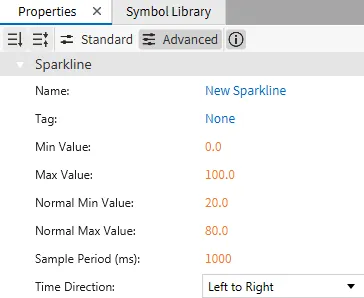
Basic Properties
The Basic Properties section allows users to set the object's Name, Min Value, Max Value, and Sampling Period. It also allows users to specify the Normal Min Value, Normal Max Value, and Normal Color.
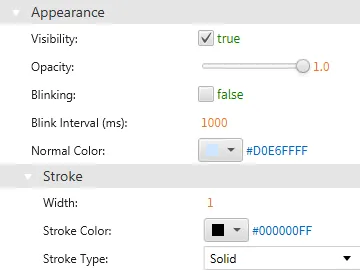
Appearance
The Appearance section enables the use of selections to alter visible characteristics.
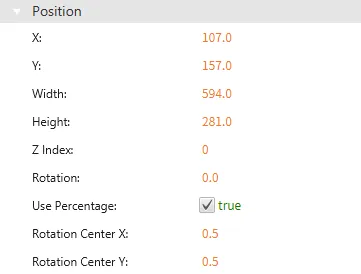
Position
The Position section provides adjustable properties that reshape or move the object.
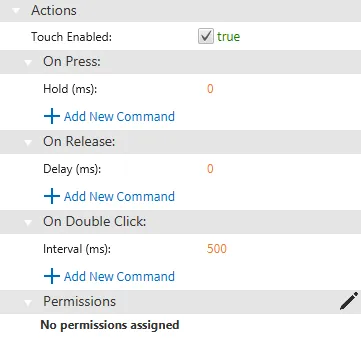
Actions
The Actions tab lets users define what happens when interacting with the sparkline. Users can specify actions for events like On Press, On Release, or On Double Click. These actions could trigger a script or another defined behavior within the application.
Permissions can be assigned to the sparkline object through the Identity and Access Management feature.